
The Same Bill
One strait. Six currencies. Six different shocks.

Chaos & Order Special Edition
M Nadal & Co Strategic Advisory | June 03, 2026
Disclaimer: This analysis represents personal observations and market intelligence from my own capital allocation process. It does not constitute investment advice. The author holds positions in instruments discussed. Directed at investment professionals and high net worth individuals under FSMA 2000.
The ECB published something remarkable this week. Gold has overtaken US Treasuries as the world’s top reserve asset. Bullion now accounts for 27% of reserve holdings, up from 20% a year ago. Treasuries fell to 22%.
Inside that headline is a detail that tells a different story. Turkey, one of the four largest gold accumulators since 2022, sold or swapped roughly 130 tonnes in three months to defend the lira against the energy shock.² Three years of building reserves, burned in a single quarter.
That is not a gold story. It is an energy story. And it is not only Turkey's.
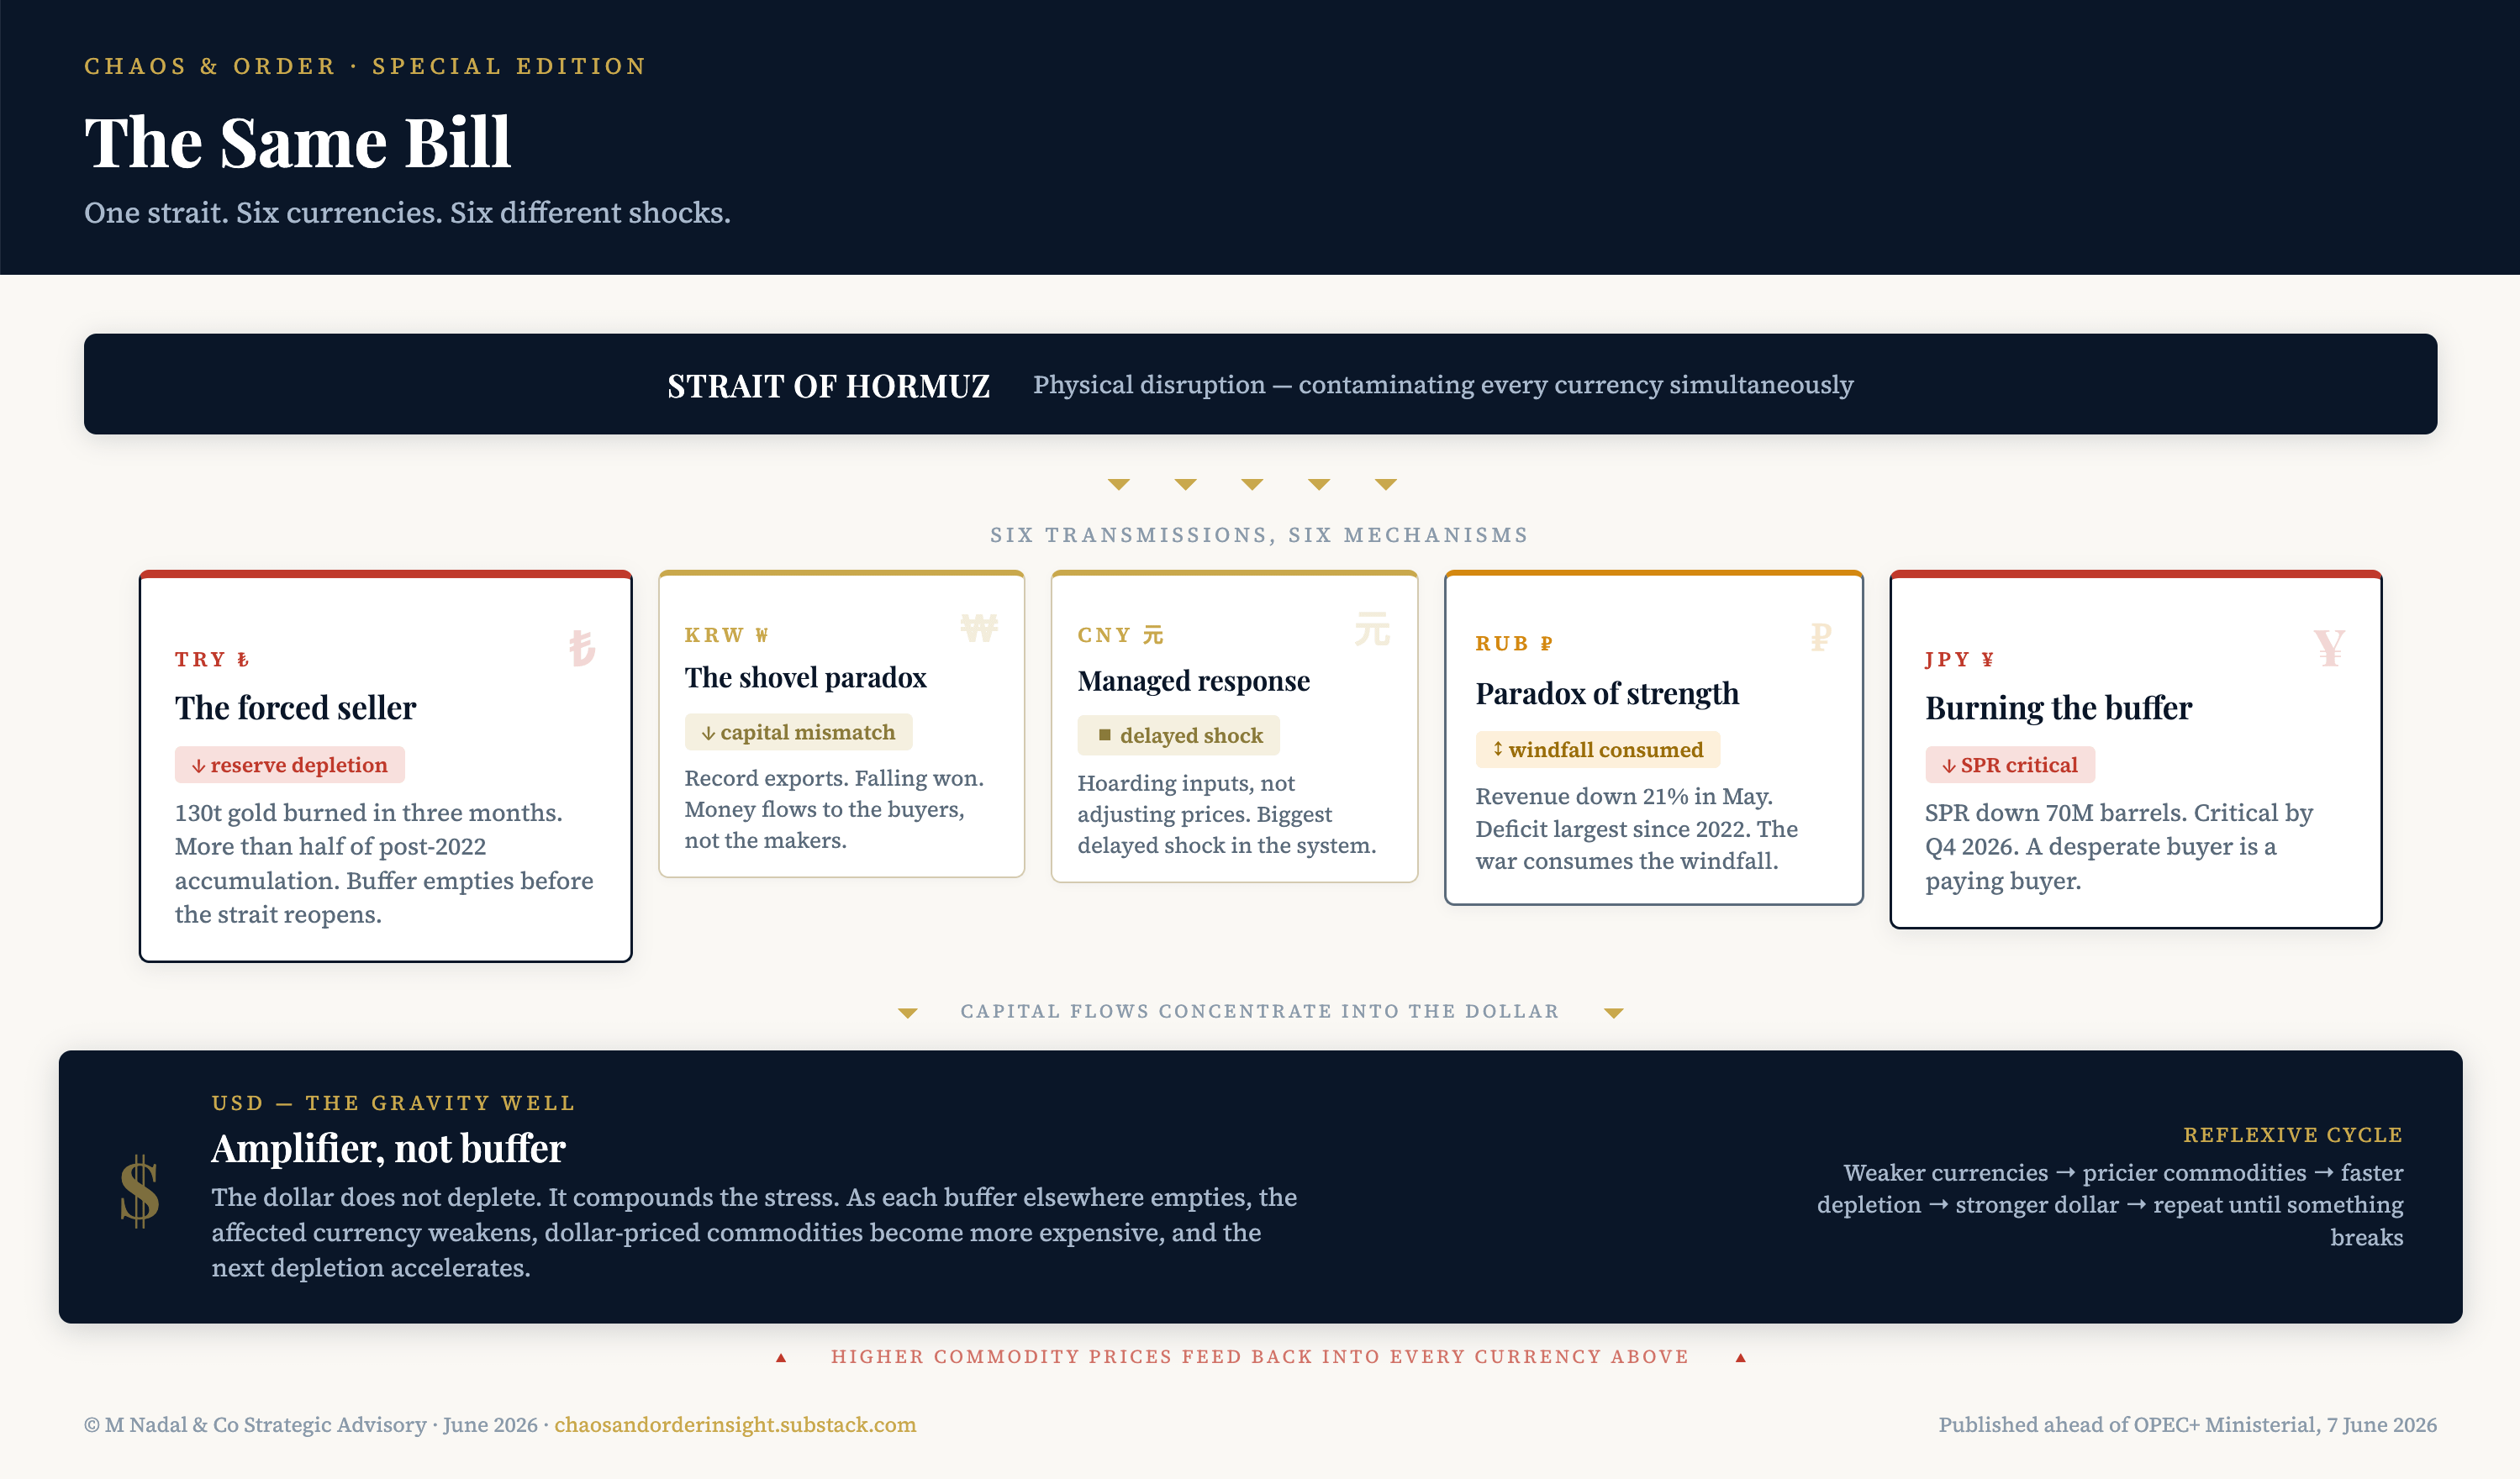
The disruption at the Strait of Hormuz is contaminating every currency simultaneously. This piece studies six, because each isolates a different type of transmission: reserve depletion, export windfall, capital flow mismatch, buffer drawdown, concentration, and managed opacity. They are not the only currencies affected. They are the ones where the transmission is cleanest.
Each of these currencies has domestic drivers that predate the war. This piece isolates the one that runs through all six.
The notable omission is the euro. It is excluded deliberately, and the reason is itself instructive. The eurozone is absorbing the shock through too many channels at once for any single mechanism to dominate. The ECB is hiking into an energy crisis. 74 of 80 surveyed economists expect a rate increase to 2.25% on June 11.³ The EU Energy Commissioner is assessing fuel rationing. European governments are signing 20-year LNG contracts and expanding defence budgets simultaneously. Inflation sits at 3.2%. The euro is where all six transmission types collide. You cannot draw a single line from Hormuz to the euro the way you can from Hormuz to the lira or the yen. The euro absorbs every transmission channel at once and isolates none of them. That is why it is not in this piece.
Turkey: the forced seller
Turkey imports its energy. When Hormuz shipping seizes up, the import bill explodes and the current account blows out with it. The lira falls, and the central bank has to step in.
Normally, central banks defend currencies by selling dollar reserves. Turkey had a more valuable reserve: gold. Accumulated methodically since 2022, 220 tonnes added before the war, the gold reserve was Turkey’s insurance policy.¹
Insurance policies get cashed.
The ECB confirmed this week that Turkey sold or swapped roughly 130 tonnes of gold alongside $26 billion in forex reserves after the Iran war began.² That is more than half of its post-2022 accumulation, gone in three months. A significant portion was used in gold-for-currency swaps, meaning the metal is contractually scheduled to return, but the buffer is consumed regardless until maturity.⁴ Turkey is a forced seller into a market where every other central bank is buying.
The structural weakness predates the war. Between 2021 and 2023, Erdogan replaced the central bank leadership with loyalists who cut rates while inflation soared. The lira was already structurally damaged before the energy shock hit.
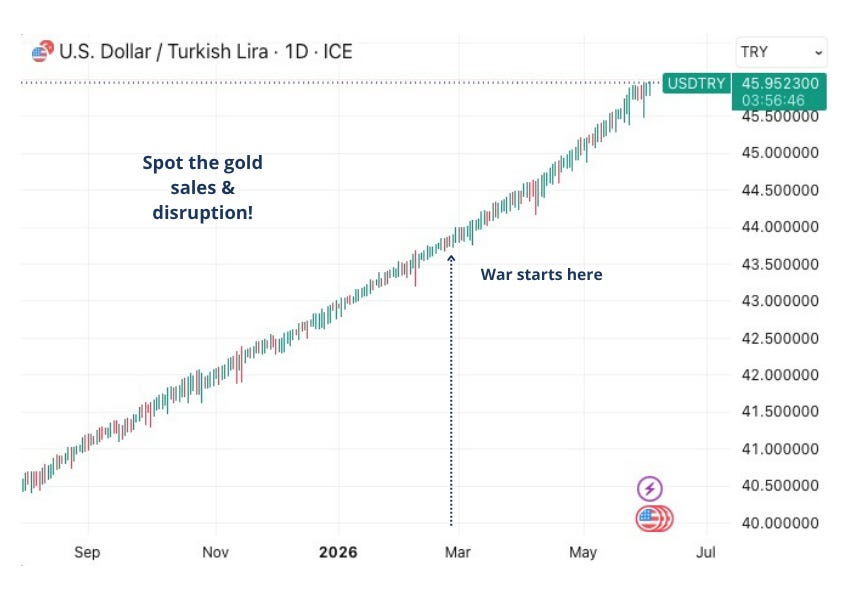
130 tonnes of gold. $26 billion in reserves. The line did not bend.
Hormuz did not break the Turkish economy. It broke the cushion that was absorbing the pre-existing fractures.
Watch the pace of reserve depletion. If Turkey continues burning gold at this rate, the buffer runs out before the strait reopens under any scenario.
Russia: the paradox of strength
Russia is on the other side of the trade, the exporter. Hormuz lifts the price of every barrel it sells, revenues climb, and the ruble strengthens with them. At a three-year high against the dollar in May, the currency looked like a war economy success story.
It is not.
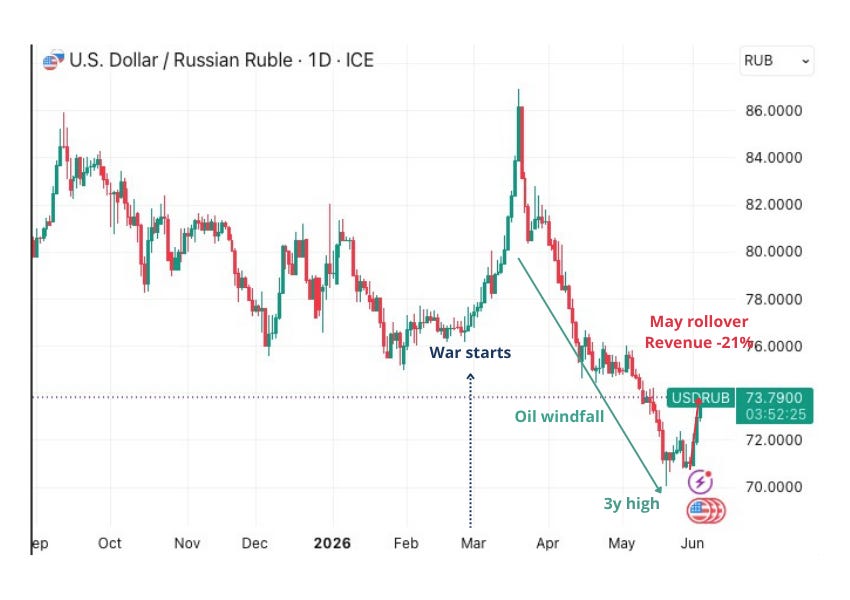
In the same quarter the ruble hit a three-year high, Russia's budget deficit reached 5.9 trillion rubles, the largest since the invasion began.⁶ The strongest currency and the biggest deficit at the same time.
A strong ruble makes non-energy Russian exports uncompetitive. Anything Russia produces other than hydrocarbons becomes more expensive abroad, from manufacturing to grain. The war economy, already consuming an extraordinary share of state spending, now faces the secondary effect of its own energy windfall: it cannot sell anything else.
The scale of the war’s fiscal drain is documented. In February, Finance Minister Siluanov wrote to the cabinet warning that military spending had overshot its budget by at least 2 trillion rubles, roughly $28 billion, and requested a freeze on all non-military expenditure.⁵ In a negative scenario, the overshoot could double.
And even the energy windfall is compressing. Ukrainian drone attacks on Primorsk and Ust-Luga are weighing on Baltic export volumes. Ukraine is deliberately sparing the pipelines and valves, holding the leverage, but targeting enough infrastructure to compress Russian tanker loadings. In May, oil and gas budget revenue fell to 678.9 billion roubles from 855.6 billion in April.⁷ The windfall is rolling over. The costs of a strong ruble compound.
Russia is also selling gold. Twenty-two tonnes in Q1 2026, drawn from reserves now at a four-year low. The war needs cash. Two energy-linked economies, Turkey and Russia, sit on opposite sides of the importer-exporter divide, and both are depleting gold reserves. For different reasons, under different pressures, driven by the same physical disruption.
What to watch: Baltic export volumes and the ruble’s effect on non-energy trade balance. If Ukrainian drone targeting intensifies and the ruble stays strong, Russia’s fiscal arithmetic deteriorates even with oil above $90.
South Korea: the shovel paradox
South Korea is running a record trade surplus on AI-driven chip demand. Export growth hit a four-decade high.⁸ The won is weaker than its export data would suggest.
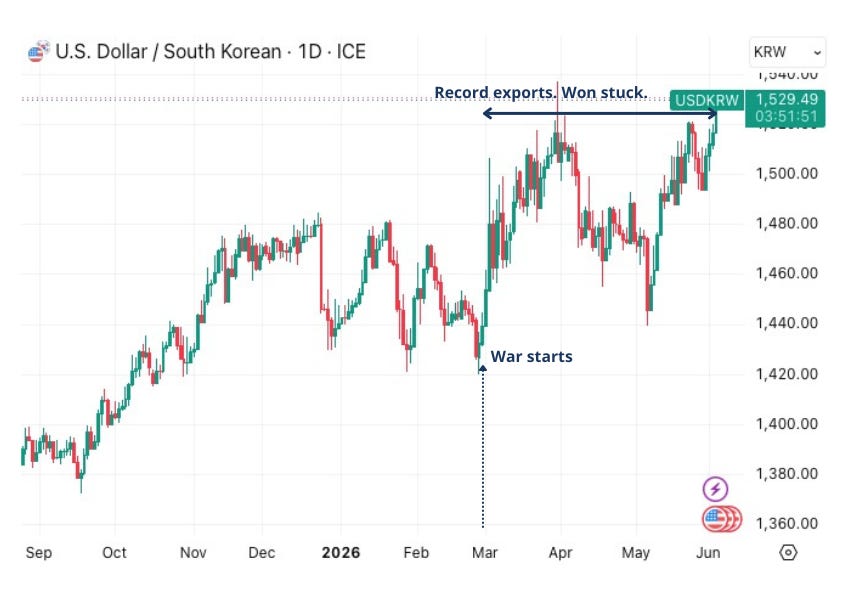
The explanation is capital flows. Global investors buy the companies that deploy the chips, not the companies that make them. South Korea produces the shovels. The money flows to the shovel buyers.
That dynamic predates Hormuz. But the energy shock compounds it, adding a second reason for capital to flow to the US: safety. AI growth and energy independence both pull in the same direction. The won cannot recover against either, let alone both.
Japan: burning the buffer
Japan is the world’s fourth-largest oil consumer, almost entirely dependent on imports. The bulk of those imports historically transit the Strait of Hormuz. When Hormuz shipping is disrupted, Japan burns through its strategic petroleum reserve.
Data from Commodity Context and Kpler showed a drawdown of roughly 70 million barrels from Japan’s SPR, a near-vertical decline.⁹ Japan had over 200 days of supply cover on paper at the start of the crisis. It is now liquidating those reserves at a rate that compresses that timeline fast.
The calm in Japanese oil procurement is not a sign that the shock is contained. It is a sign that the buffer is being spent.
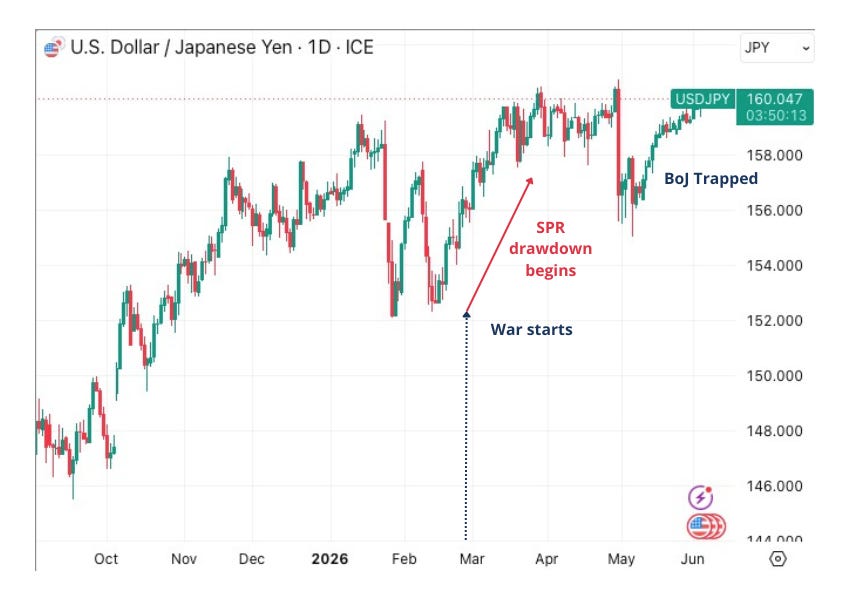
When the buffer empties, price becomes the only adjustment mechanism. Turkey burns gold to defend the lira. Japan burns oil to delay the price. Different asset, same trade, and the same ending if Hormuz stays shut.
Iran sees this. Last week, President Pezeshkian offered Japan “smooth and easy passage” through the strait, a bilateral transit deal. Iran is not offering this out of diplomacy. It is offering it because Japan is desperate and a desperate buyer is a paying buyer.
The yen adds a second layer. The Bank of Japan remains accommodative while the Fed and ECB tighten. Governor Ueda admitted this week he cannot say where the neutral rate sits. The BOJ is steering blind.¹⁰ The rate differential weakens the yen, which raises the yen cost of dollar-priced oil imports, which accelerates reserve depletion. If the BOJ is eventually forced to hike to defend the yen, carry trade leverage built over years of low Japanese rates unwinds. That affects not just Japan but every global risk asset funded with yen-denominated borrowing.
Watch Japan’s SPR drawdown rate. If reserves continue falling at the current pace, Japan reaches critical levels by Q4 2026. The Pezeshkian bilateral deal becomes more likely to close. And the BOJ faces an impossible choice between defending the yen (which requires hiking, which triggers carry trade unwind) and accommodating the economy (which requires holding, which lets the yen weaken further and makes oil more expensive).
The dollar: the gravity well
The dollar strengthens alongside oil. That should not happen, and the reason it does is the whole story.
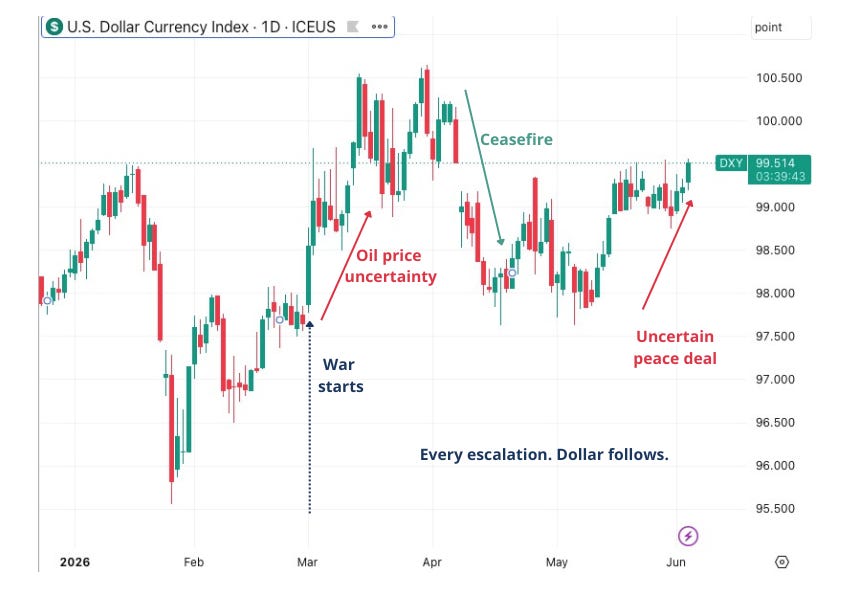
The same AI boom pulling capital out of the won pulls it into the dollar. Money flows to US assets and stays there. The dollar absorbs global capital instead of recycling it out.
The Hormuz disruption reinforces this. Energy-importing economies weaken (Turkey, Japan, South Korea, as documented above). Energy-exporting economies see temporary strength that masks structural problems (Russia). Capital that might have stayed in emerging markets or commodity-producing economies migrates to the US, where the two dominant narratives of the moment, AI growth and geopolitical safety, both pull in the same direction. And unlike every other economy in this piece, the US is also exporting crude, LNG and refined products at Hormuz-elevated prices.
The dollar is not a buffer in the way Turkey’s gold or Japan’s SPR is a buffer. It does not deplete. It is the mechanism that transmits stress from the other five. As each buffer elsewhere depletes and each currency weakens, dollar-priced commodities become more expensive for the rest of the world. That accelerates the next buffer’s depletion. The dollar is amplifying the shock.
The Fed cannot offset this. Inflation is sticky: PCE at 3.8%, core at 3.3%, GDP missing at 1.6%.¹¹ The ECB is hiking next week. Warsh, chairing his first FOMC on June 16-17, inherits a position where the economy needs easing but inflation demands tightening. A strong dollar typically eases inflationary pressure by cheapening imports, but with Hormuz disrupted, the one import that matters most, energy, is not responding to currency moves.
Watch the DXY-oil correlation. If it persists, the dollar strengthens into the energy shock rather than despite it, and the Fed’s room to manoeuvre narrows further.
The yuan: the managed response
China’s currency does not float freely. Where Turkey’s lira and Japan’s yen absorb the disruption through market moves, China absorbs it through policy decisions visible only in secondary data.
The onshore yuan is at multi-year highs.
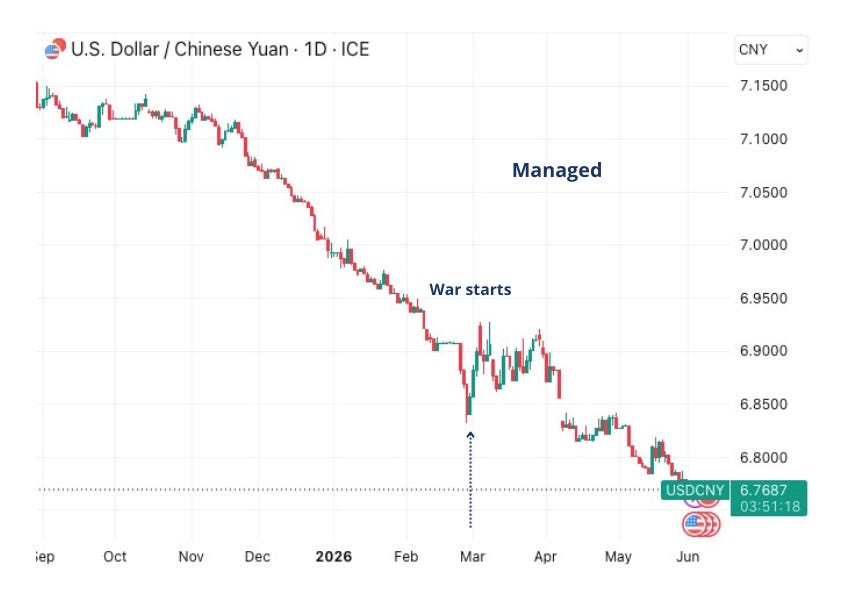
This looks like strength. Look closer. China is hoarding inputs, not adjusting prices. It suspended sulfuric acid exports.¹² It is accumulating gold.¹ It is drawing down oil stockpiles to avoid bidding up the spot market. Every one of these is a policy decision that a freely floating currency would instead express as a price move.
When Turkey sells gold, the world sees it. When China draws down inventories, the world does not see the depletion until the buffer is gone. China’s managed calm is the biggest delayed shock in the system.
Buying time
Each of the six sections above describes a different absorption mechanism. Turkey absorbs through gold. Japan absorbs through reserves. China absorbs through inventory drawdowns. These are buffers: finite, measurable, and depleting. The dollar is not a buffer. It is the transmission mechanism that compounds the stress as each buffer elsewhere runs down.
The buffers are depleting in a sequence, on timescales ranging from weeks (diesel) to quarters (gold, oil reserves) to years (settlement infrastructure). The order most likely determines what breaks next.
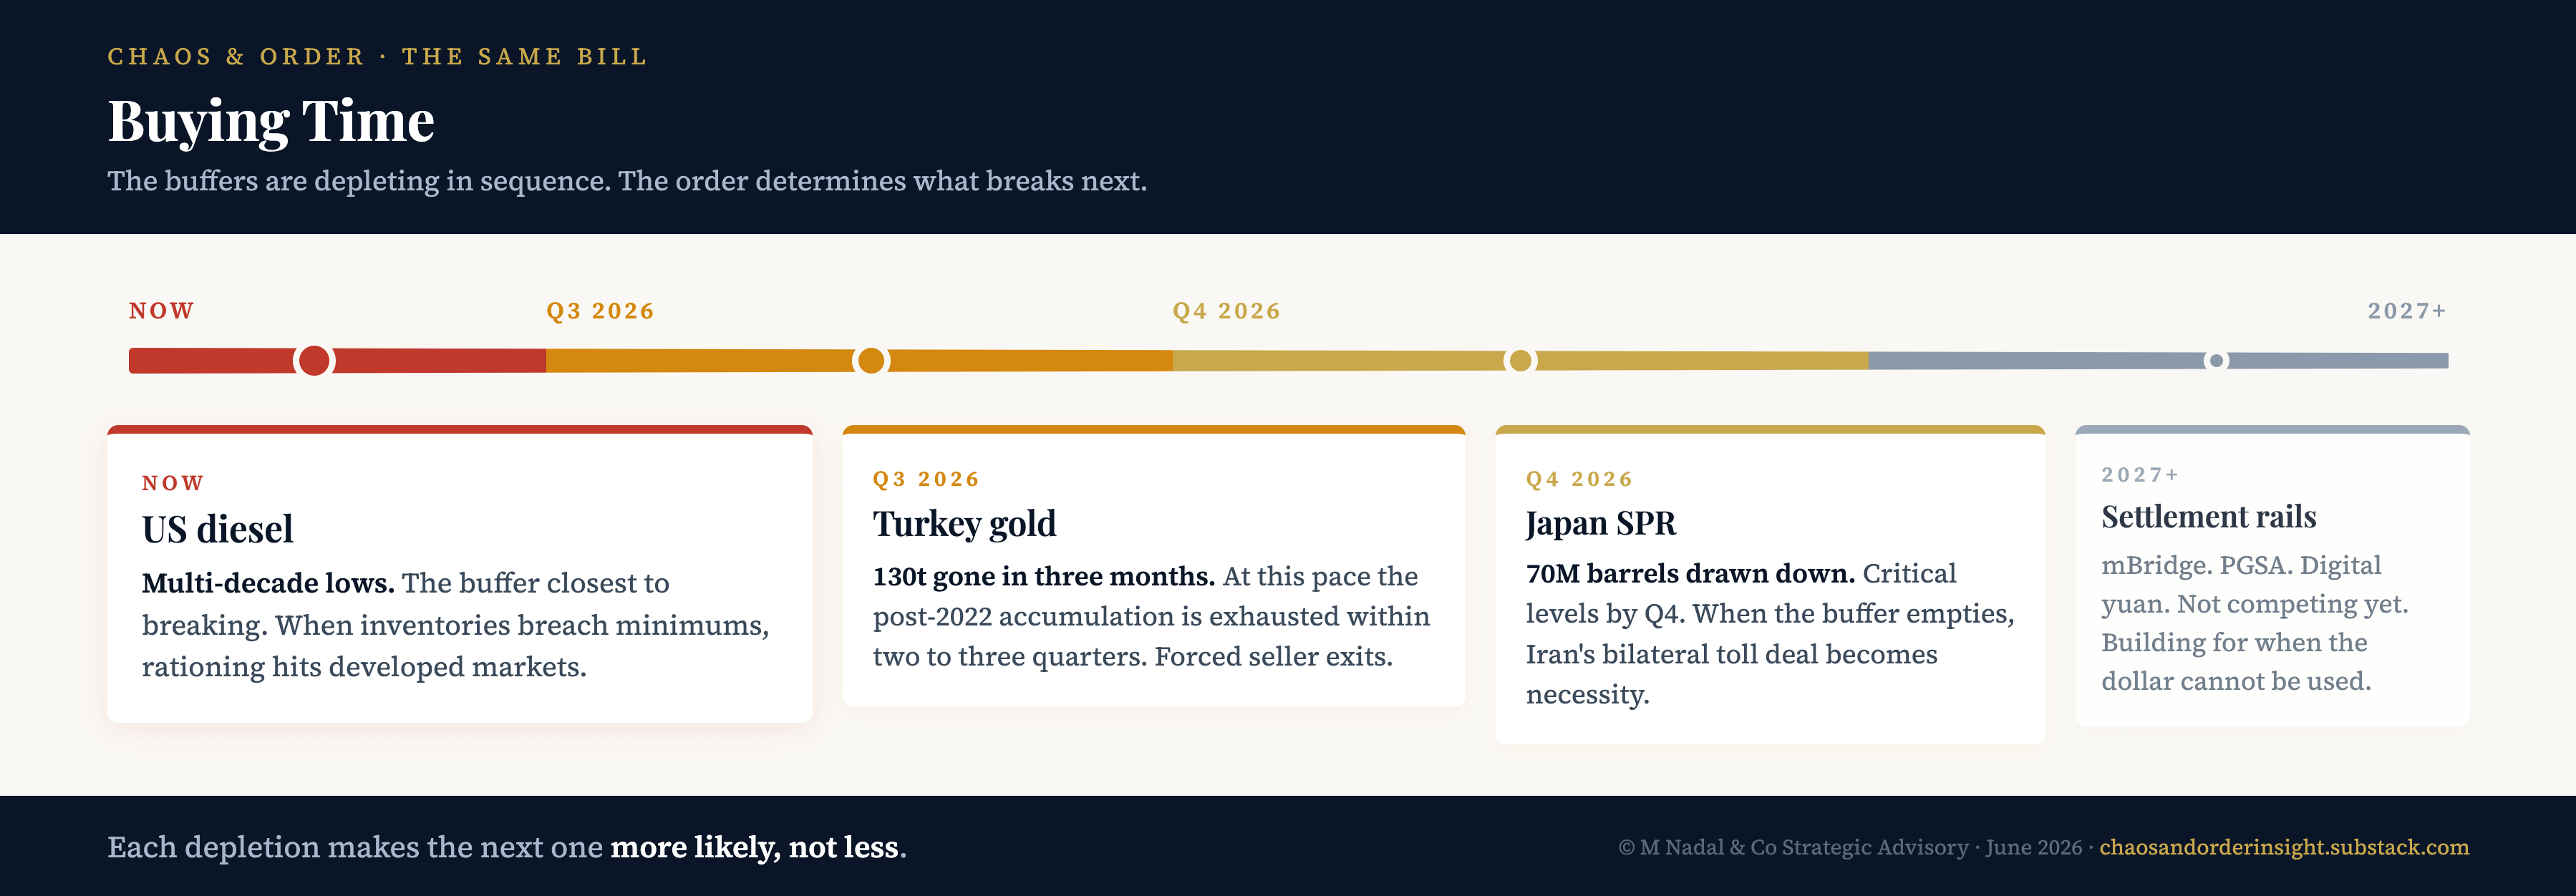
US diesel stockpiles are already at multi-decade lows.¹⁵ That is the buffer closest to operational limits. If diesel inventories fall below minimums, rationing moves from emerging markets, where it is already happening, to developed markets. European diesel prices, already at record levels, reprice again.
Turkey’s gold reserve is next. At the current pace of depletion, the post-2022 accumulation is gone within two to three quarters. When Turkey stops selling, a forced seller exits the gold market. The gold price finds support at a structurally higher level. Every other central bank’s reserve calculus adjusts.
Japan’s SPR follows. At current drawdown rates, strategic reserves approach critical levels by Q4 2026. When the buffer empties, price becomes the only adjustment mechanism. The Pezeshkian bilateral transit deal becomes more likely to close, not as a diplomatic achievement but as a necessity. If it does, the toll road entrenches because the buyer has no alternative.
The most probable compounding sequence runs through these connections: Japan’s buffer emptying makes the bilateral deal more likely, which entrenches the toll road, which keeps Hormuz functionally constrained, which keeps Turkey burning gold. Turkey exhausting its gold removes a forced seller, which lifts the gold price, which changes the reserve arithmetic for every central bank still accumulating. None of these links is certain. Each is probabilistic. But the direction of causation is consistent, and each depletion makes the next one more likely, not less.
The dollar amplifies this. As each buffer depletes, the affected currency weakens. Weaker currencies make dollar-priced commodities more expensive. More expensive commodities accelerate the next buffer’s depletion. The dollar strengthens further. This is a reflexive cycle, not a one-time adjustment. It tightens until something breaks it.
Three things could break it:
A physical reopening of Hormuz with verified commercial traffic: sustained transit above pre-war volumes, not a ceasefire headline.
A US recession deep enough to contract demand below constrained supply: visible in consecutive quarters of negative GDP and unemployment rising above 5%.
Or a BOJ rate hike above 1% that triggers carry trade unwind and reverses the capital flows sustaining the dollar.
Each is a scenario, not a base case. Until one materialises, the sequence continues.
Six currencies. Six different mechanisms. One physical disruption.
No single currency view captures this. The physical disruption at Hormuz is the common cause. The currencies are six different readings of the same underlying pressure.
The bill arrives at different times in different currencies. But it is the same bill.
If this connected something you had not seen mapped together, share it with someone who should.
Earlier editions in this series: Commodity Origami (Edition 19), Currency Debasement Special Edition. Published the physical delivery mechanics underlying gold’s reserve role in the October 2025 Gold Market Structure Vulnerability Strategic Advisory Brief. The Hormuz framework underpinning this analysis: Four Clocks: The Gate Has Changed Everything.
Subscribe to Chaos & Order for the editions, briefings, and frameworks that connect what the specialist desks miss.
Sources
¹ ECB, International Role of the Euro, June 2026. FT, “Gold replaces US Treasuries as world’s top reserve asset, ECB says,” 2 June 2026. Turkey accumulated 220 tonnes since 2022; Tether was the single largest buyer in 2025 (>100 tonnes).
² Reuters, “Turkish gold reserves largest drop in 7 years, data shows,” 26 March 2026. ECB, June 2026: Turkey “sold or loaned 130 tonnes of gold after the start of the Iran war.”
³ FinancialJuice poll, 3 June 2026. Previous month: 59 of 70.
⁴ Reuters / GoldSilver.com: significant portion used in gold-for-currency swap arrangements.
⁵ FT, leaked internal documents, February 2026. Finance Minister Siluanov warned of 2 trillion ruble ($28bn) military budget overshoot and requested freeze on non-military expenditure.
⁶ Kyiv Post / Bloomberg, citing Russian Finance Ministry data. Deficit of 5.9 trillion rubles in January-April 2026.
⁷ Russian Finance Ministry via First Squawk, 3 June 2026.
⁸ Reuters, “South Korea export growth hits four-decade high as chip sales hit record on AI boom,” 1 June 2026.
⁹ Commodity Context / Kpler, June 2026. Japan SPR drawdown data.
¹⁰ BOJ Governor Ueda, remarks reported by First Squawk, 3 June 2026.
¹¹ BEA. PCE April: headline +3.8% y/y, core +3.3%. GDP Q1: +1.6% vs +2.0% consensus.
¹² Fastmarkets / China Chemnet, April 2026. China sulfuric acid export restriction effective 1 May 2026.
¹³ Atlantic Council, mBridge cumulative transaction data. $55.49 billion across 4,000+ cross-border transactions. Digital yuan accounts for approximately 95% of settlements.
¹⁴ TRM Labs; Chainalysis; The Conversation, “Crypto tolls in the Strait of Hormuz,” 2026. PGSA mandates settlement in BTC, USDT, or CNY via CIPS.
¹⁵ Bloomberg / DOE, P.J.K International, Enterprise Singapore. Combined diesel inventories for Europe, US, and Singapore at multi-decade lows as of June 2026.
M Nadal & Co Strategic Advisory chaosandorderinsight.substack.com
This analysis represents professional judgment based on 25 years in commodities markets. Views expressed do not constitute recommendations for purchase or sale of any securities.
© M Nadal & Co Strategic Advisory · June 2026 · chaosandorderinsight.substack.com
Great article Marjorie, actually interesting
Subscribed, would love to have you along too🙂🙌
Joys of a multi polar world. Practical short term, improbable long term.
Survival or irrational logic, take your pick?